-
BK-XVIII: Measurement of BICEP3 polarization angles and consequences for constraining cosmic birefringence and inflation
The BICEP/Keck Collaboration, Phys. Rev. D 111, 063505, 2025
| Figures | Download Bundle | ||
|---|---|---|---|
| EB and TB spectra vs rotation angle | 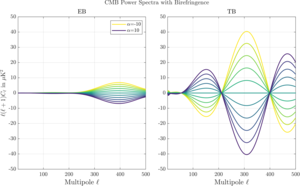 |
Figure 1: EB and TB power spectrum for a rotation angle α ranging from -10° to 10°. | PDF / PNG |
| Rotating polarized source | 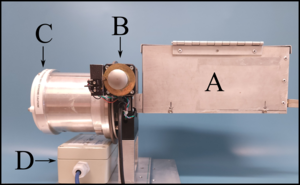 |
Figure 2: Rotating Polarized Source. An electrically chopped, quasi-thermal noise source (A) is fixed to a rotation stage (B) such that the feedhorn of the source is co-linear with the stage's axis of rotation. We place a wire grid (C) in front of the feedhorn to further polarize the output. We calibrate and monitor the orientation of the wire grid with respect to gravity using a high-precision tilt meter (D). | PDF / PNG |
| RPS modulation curve | 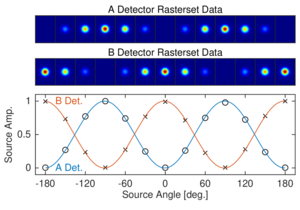 |
Figure 3: Top: Binned and smoothed RPS timestreams for A and B orthogonal detectors of a given pair, showing modulated beams. Bottom: Resulting modulation curve data (x/o's) and fits to the model (lines). | PDF / PNG |
| Angle definitions | 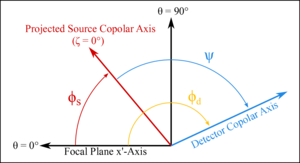 |
Figure 4: Angles definition in instrument fixed coordinates. The θ=0° and θ=90° lines define the instrument-fixed, boresight centered coordinate system, as shown for example in Figure 2 of Ref. 49. The ζ=0° line is the projection of the RPS zenith on the focal plane. The quantity we directly measure is ψ, the detector response angle to the RPS signal. We add this to φs, the angle between the focal plane and the RPS zenith, to get the quantity φd, the angle of the detector in instrument-fixed coordinates. | PDF / PNG |
| Beam center residuals | 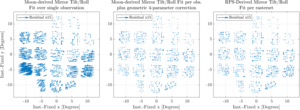 |
Figure 5: Beam center residual quiver plots for one observation, projected from polar coordinates (r, θ) to cartesian coordinates (x=r cosθ, y=r sinθ). Left: Residuals when keeping the mirror position fixed to the Moon-derived position for the analysis of the entire RPS observing campaign. Center: Residuals when fitting a global rotation and translation to the initial pattern. Right: Residuals when using RPS data to constrain the mirror position during the RPS observing campaign. | PDF / PNG |
| Polarization angle calibration results | 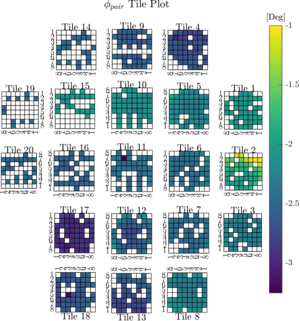 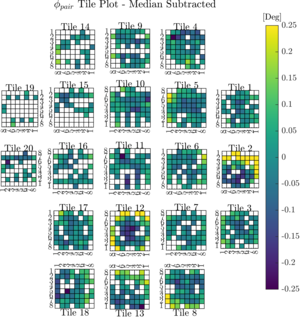 |
Figure 6:Calibration results of polarization angles across the focal plane. The left panel shows the median value of φpair for each pair over 10 observations. The pattern over the focal plane is dominated by per-tile effects. In the right panel, the median angle for each tile has been subtracted, and smaller variations within tiles are seen (note the different color scale). | PDFa / PNGa PDFb / PNGb |
| Polarization angle comparison | 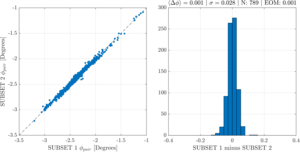 |
Figure 7: A comparison of two subsets of polarization angles, split evenly across 10 observations. The left plot shows the subsets plotted against each other with each point representing a detector pair. The right plot shows a histogram of the per-pair differences between the two subsets. These plots indicate excellent internal consistency within the data. | PDF / PNG |
| Polarization angles across observations | 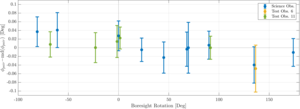 |
Figure 8: Per-pair polarization angles φpair across observations at different deck angles. We note a good repeatability across all observations, including the test observations that had a different scanning strategy — more details about these test observations can be found in Ref. 42. Observations taken at the same boresight rotation angle have been slightly offset for visual purposes. | PDF / PNG |
| Per-tile polarization angles vs module clocking | 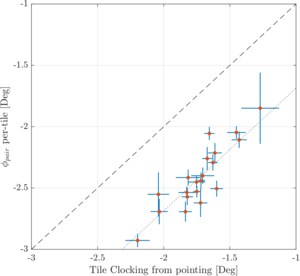 |
Figure 9: Plot of per-tile averages of polarization angles extracted from RPS data vs. module clocking extracted from CMB data, showing strong correlation between these two independent measurements. | PDF / PNG |
| ISAAC benchtop calibrator | 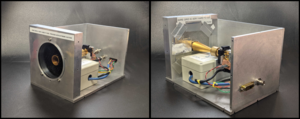 |
Figure 10: Images of the ISAAC benchtop calibrator. Incident radiation is polarized by a wire grid before coupling with a 25 dB corrugated feedhorn. The signal is amplified by 10 dB by a low-noise amplifier before terminating onto a GaAs detector diode. RF absorber enshrouds the feedhorn to mitigate errant reflections from entering the waveguide. Lastly, a TuffTilt tilt meter is used to register the orientation of the wire grid to gravity. | PDF / PNG |
| RPS-ISAAC angle error vs alignment offset | 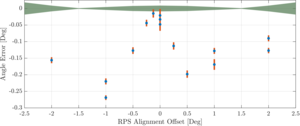 |
Figure 11: Scatter plot of the RPS-ISAAC angle error as a function of alignment offset. The error bars are the standard deviations over 10 independent measurements multiplied by an additional factor of 2 for visualization purposes. The green area represents the expected error calculated from geometric projections of polarized light from the RPS. As detailed in Sec. II D 2, these deviations have been studied in the lab and their origin traced to multi-path effects and side lobes of the RPS horn interfering with other elements of the setup. The effect will be mitigated for future campaigns. | PDF / PNG |
| RPS-ISAAC polarization angles | 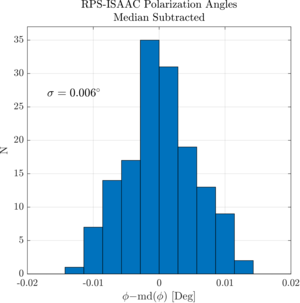 |
Figure 12: A histogram of polarization angles derived from measurements between the RPS and ISAAC, demonstrating the small statistical uncertainty of the benchtop measurements. | PDF / PNG |
| Angle estimates from CMB power spectra | 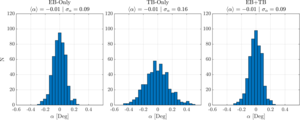 |
Figure 13: Histograms of angle estimates from CMB power spectra with angles fit to EB-only, TB-only, and a combined EB+TB estimator. Because TB contributes no additional information to the fit, only noise, the combined EB+TB estimator has roughly the same scatter on α as the EB-only fit. | PDF / PNG |
| Angle estimates for different multipole ranges | 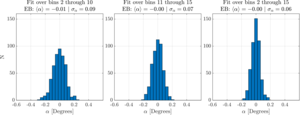 |
Figure 14: Demonstration of the constraining power on α when fit over different multipole ranges. Adding 5 additional bins compared to the mainline CMB analysis (bins 11 to 15) increases the constraining power on α by 30%. | PDF / PNG |
| Calibrated vs uncalibrated EB power spectra | 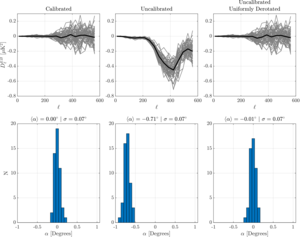 |
Figure 15: Plots of calibrated and uncalibrated ΛCDM+Noise+Dust simulations, with EB power spectra on the top row and angle best-fits on the bottom row. While the scatter on the angles are all the same, the impact of a multiplicative uncertainty from beam window function errors would be greater if EB is non-zero. For that reason, we de-rotate the maps by the mean uncalibrated angle and fit angles to the sims again. | PDF / PNG |
| Δα for uncalibrated vs calibrated approach | 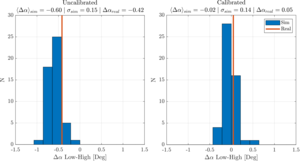 |
Figure 16: We compute the Δα quantity defined in Eq. (14) for the uncalibrated (left) and calibrated (right) approach, on both simulations (blue histograms) and real data (red line). The difference between the “high” and “low” subsets goes away as expected when using RPS measured angles, which validates that these angles are a better representation of reality than idealized assumptions used in the uncalibrated approach. | PDF / PNG |
| EB contamination from temperature-to-polarization leakage | 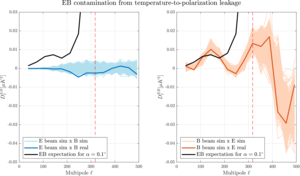 |
Figure 17: EB contamination from temperature-to-polarization leakage. For each panel, the darker line is the cross with real data, and the lighter lines show the cross with 499 signal+noise+dust simulations. The black line is the expectation value for the EB spectra from isotropic polarization rotation for α=0.1°. The vertical dash line is the separation between the 9- and the 14-bandpower case. The left panel shows the contribution from E beam sim × B CMB, which is noise dominated and well below the equivalent α=0.1°. The right panel shows the contribution from B beam sim × E CMB, driven by TE correlations in the CMB and T-to-B leakage from the instrument. | PDF / PNG |
History
- 2024-11-05: Posted BK-XVIII: Measurement of BICEP3 polarization angles and consequences for constraining cosmic birefringence and inflation figures.