| Test statistic for consistency with background model |
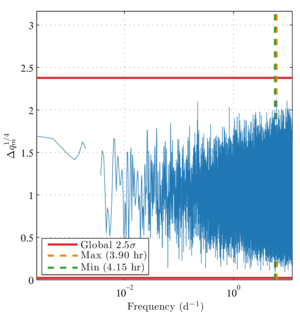 |
Figure 1: The test statistic \(\Delta q_m\) for consistency with the background model (BK-XII Eq. 67) for real data from the 2012–2015 observing seasons of the Keck Array. We plot \(\Delta q_m^{1/4}\) on the vertical axis in order to compress the distribution for visual purposes, and we plot frequency \(m/(2\pi)\) in units of inverse days (\(d^{−1}\)) on the horizontal axis. The maximum and minimum values are indicated in the legend with their corresponding oscillation periods. The levels for global \(2.5\sigma\) fluctuations in both directions are indicated by horizontal red lines, i.e., there is a 1.2% probability in the background model that at least one value of \(\Delta q_m\) will lie outside the region bounded by the red lines. The visible gap at frequency \(1/365 \, d^{−1}\) represents an intentional avoidance range (Sec. III G).
|
PDF / PNG |
| Bayesian 95% confidence upper limits |
 |
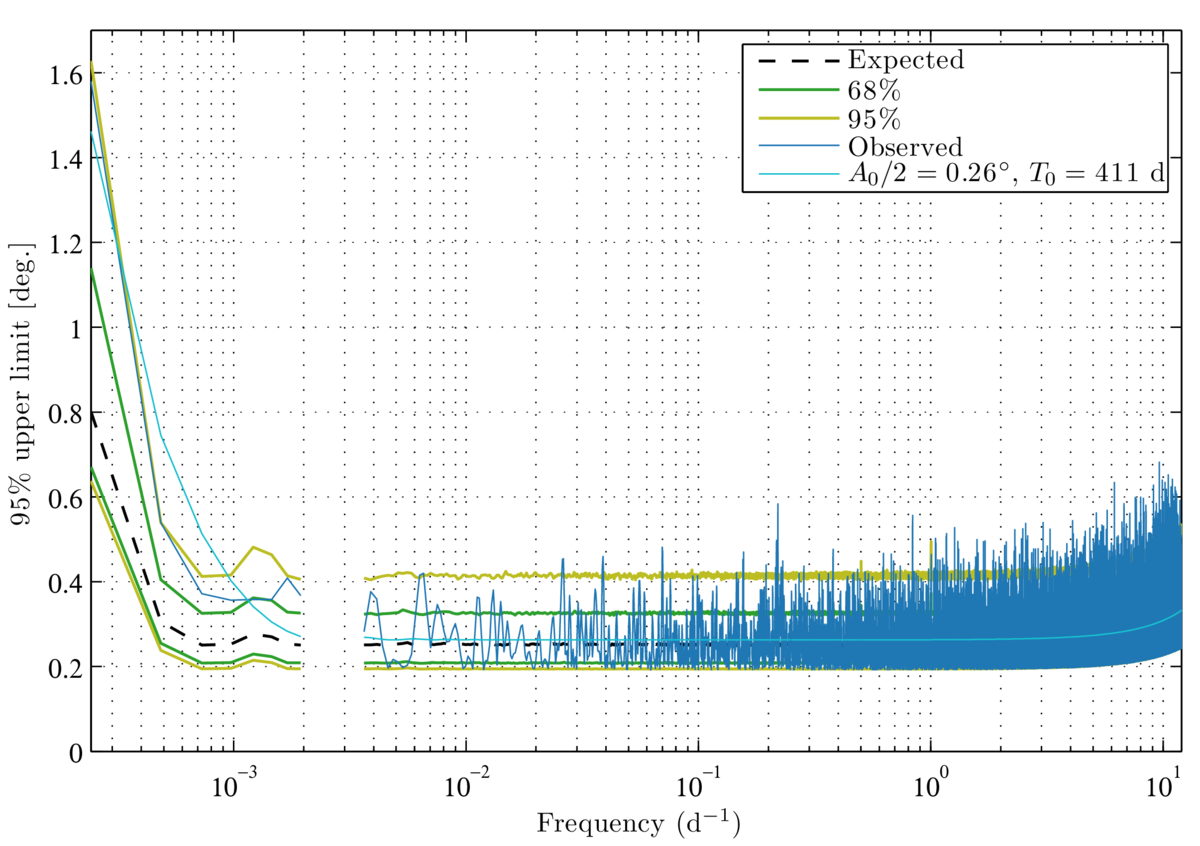
Figure 2: Bayesian 95%-confidence upper limits on rotation amplitude \(A/2\) (BK-XII Sec. IV C). We also provide the median expectation (black dashes) from background-only simulations as well as \(1\sigma\) (green) and \(2\sigma\) (yellow) regions. These expectations represent local rather than global percentiles. With nearly \(5 \times 10^4\) frequencies under consideration, we expect several values outside of the \(2\sigma\) region. Background consistency is addressed in Sec. IV D and Fig. 1. The median limit for oscillation periods between 1 and 30 d is \(0.27^\circ\). For shorter periods (larger frequencies), the limits are degraded due to binning observations in \(\sim\)1-hr scansets (BK-XII Sec. III C). For longer periods (smaller frequencies), the limits are degraded due to the residual oscillation in the coadded maps (Sec. III D). The breaks in the data are due to the avoidance frequencies discussed in Sec. III G. Additionally, we plot a smoothed approximation to our upper limits (Eq. 14) in cyan.
|
PDF / PNG |
| Exclusion plot |
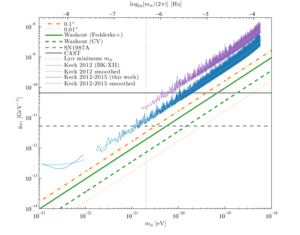 |
Figure 3: Excluded regions in the mass-coupling parameter space for axion-like dark matter (cf. BK-XII Fig. 6). All constraints push the allowed regions to larger masses and smaller coupling constants, i.e., toward the bottom right of the figure. If the dark matter is assumed to consist entirely axionlike particles, i.e., if \(\kappa = 1\), then our constraints (blue) are immediately implied by Eq. 4 of BK-XII and the results of Fig. 2. A smoothed approximation is shown in cyan (Eq. 15). The analogous limits and smoothed approximation from BK-XII are shown in purple and magenta. The orange dot-dashed and dotted lines show the constraints that would be achieved if the rotation amplitude were constrained to \(0.1^\circ\) and \(0.01^\circ\), respectively. The green
solid line shows the constraint set by Fedderke et al. from the washout effect (BK-XII Sec. I) in Planck power spectra. The dashed green line shows the cosmic-variance limit for the washout effect. The dashed grey horizontal line shows the limit from the lack of a gamma-ray from SN1987A. The solid grey horizontal line is the limit set by the CAST experiment. The dotted grey vertical line is a constraint on the minimum axion mass from observations of small-scale structure in the Lyman-\(\alpha\) forest, and we note that several similar bounds have also been set by other considerations of small-scale structure.
|
PDF / PNG |