| Raw power spectra |
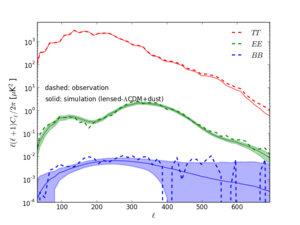 |
Figure 1: Raw temperature, E-, and B-mode spectra (dashed lines) measured from BK14, compared with those from lensed-ΛCDM+dust+noise simulations. (Both have been noise debiased but no beam or filtering correction has been applied.) For the simulations the solid line shows the mean value and the shaded region the ±1σ range. The temperature sky input to the simulations is constrained to be the actual sky pattern as observed by Planck so there is no sample variance in the simulated TT spectra.
|
PNG |
| Lensing-mass power spectrum |
 |
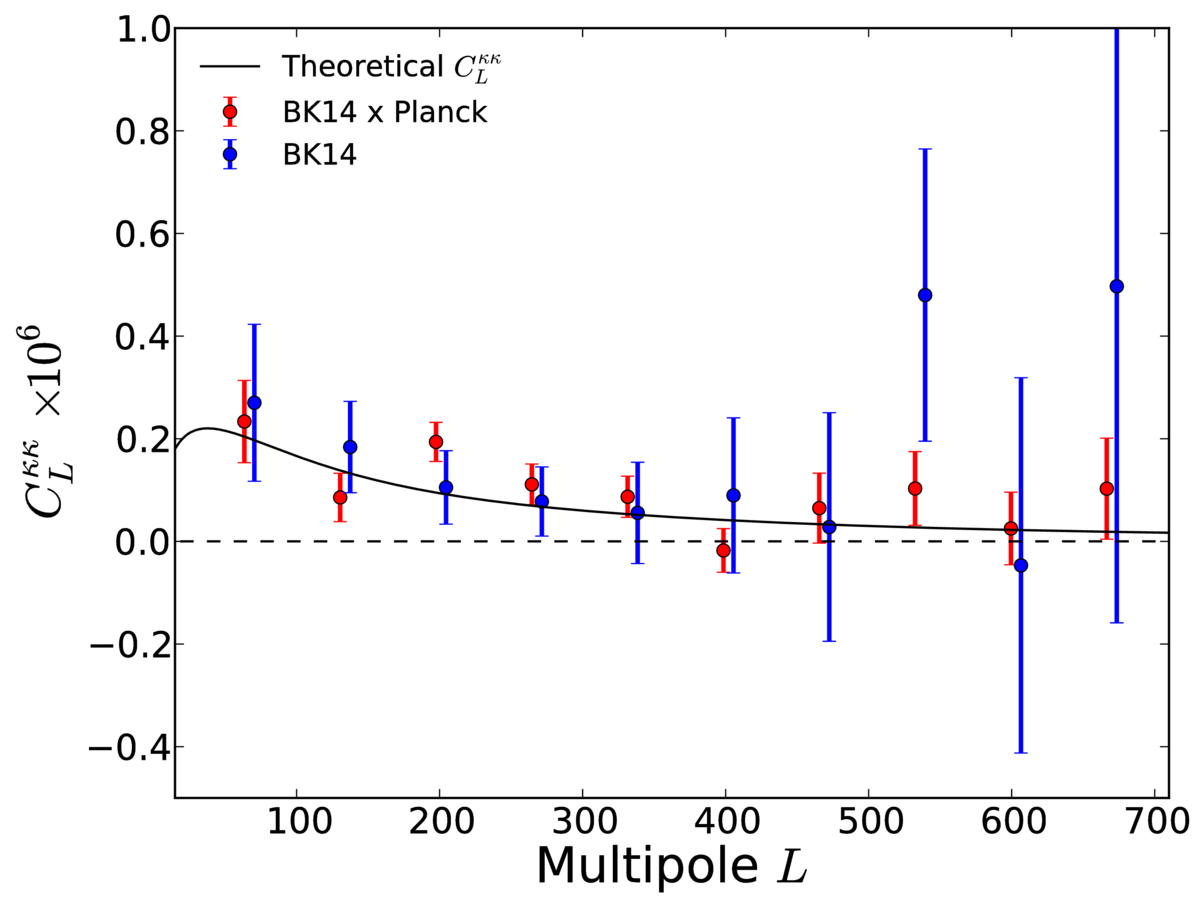
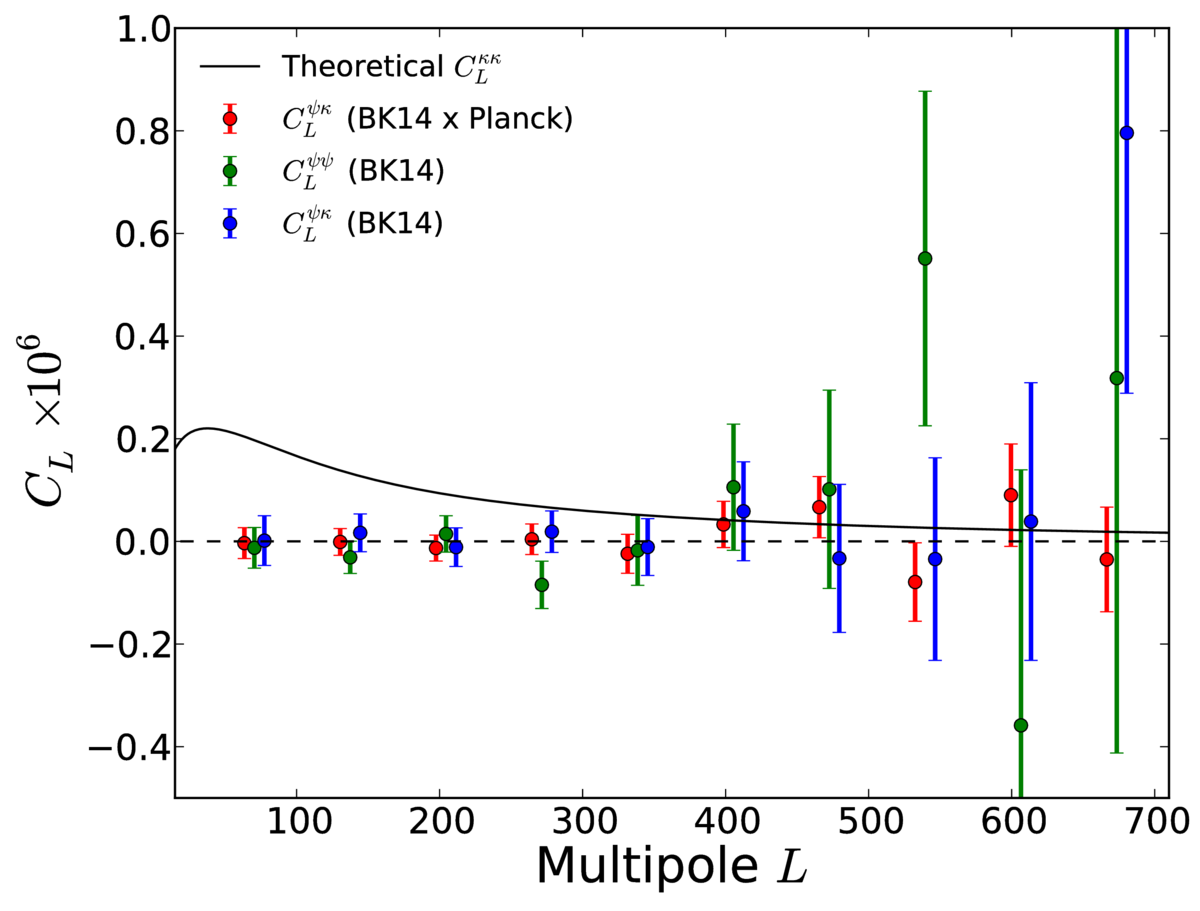
Figure 2: The lensing-mass power spectrum, CLκκ = L4 CLφφ/4, estimated from the cross-spectrum between BK14 and Planck 2015 data (red), and the auto-spectrum of BK14 data (blue). The black solid line shows the theoretical spectrum assuming the ΛCDM cosmology. The BK14 auto-spectrum is offset in L for clarity.
|
PDF / PNG |
| Amplitudes of lensing potential cross-spectra |
 |
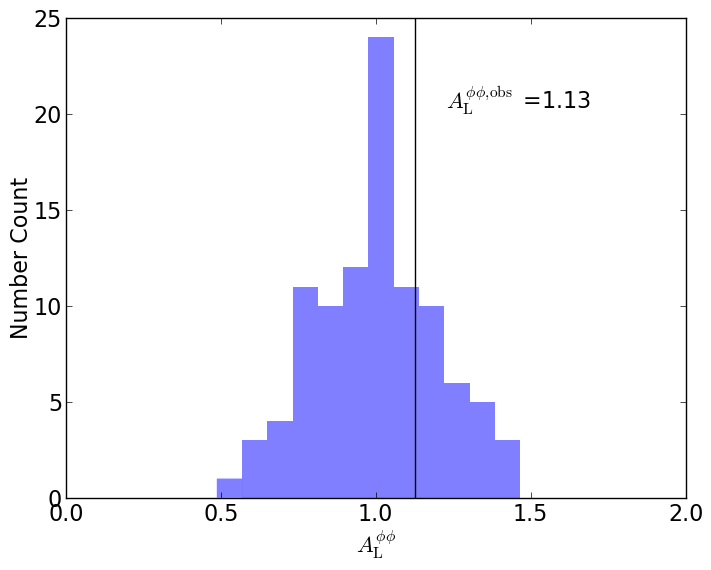
Figure 3: The amplitudes of the cross-spectra of BK14 and Planck 2015 lensing potential maps reconstructed from lensed-ΛCDM+dust+noise simulations (histogram), and the observed value (vertical line).
|
PNG |
| Amplitudes of lensing potential auto-spectra |
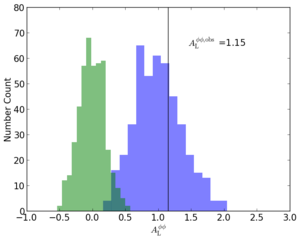 |
Figure 4: The amplitudes of the auto-spectra of BK14 lensing potential maps reconstructed from lensed-ΛCDM+dust+noise simulations (blue histogram), and from unlensed-ΛCDM+dust+noise simulations (green histogram). The observed value is indicated by the vertical line.
|
PNG |
| Lensing-mass power spectrum |
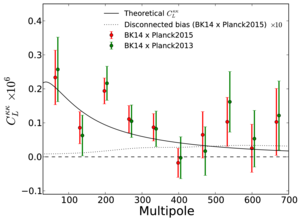 |
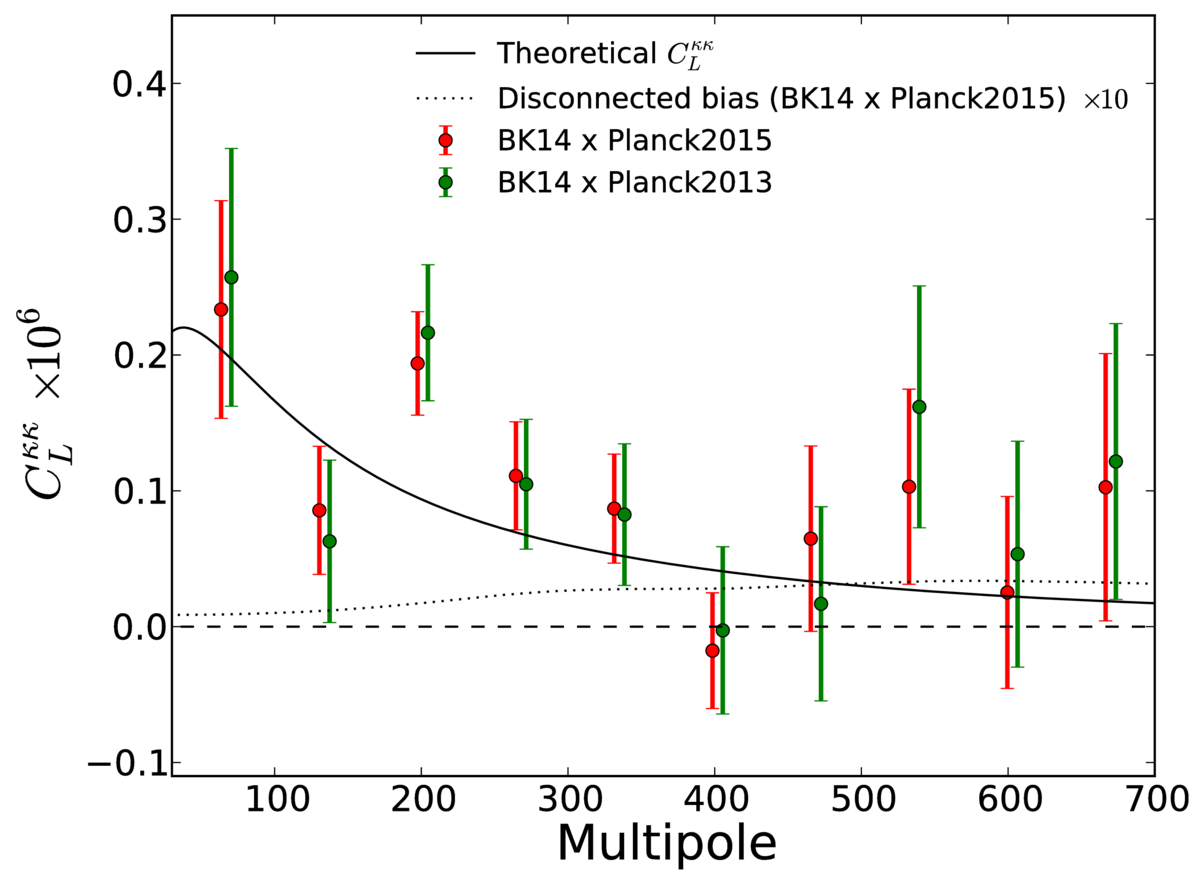
Figure 5: The lensing-mass power spectrum, CLκκ = L4 CLφφ/4, estimated from the cross-spectrum between BK14 and Planck 2015 data compared with that between BK14 and Planck 2013 data. We also show the theoretical expectation of the disconnected bias in the cross-spectrum between BK14 and Planck 2015 data multiplied by 10. The cross-spectrum between BK14 and Planck 2013 is offset in L for clarity.
|
PDF / PNG |
| Curl null test |
 |
Figure 6: Curl null test — The cross-spectrum of the curl-mode reconstructed from the BK14 data and the Planck lensing-mass field (red), the auto-spectrum of the BK14 curl-mode (green), and the cross-spectrum of the BK14 lensing-mass field and curl-mode (blue). For comparison, we also show the theoretical lensing-mass power spectrum (black). The power spectra are offset in L for clarity.
|
PDF / PNG |
| Jackknife χ2 PTE values |
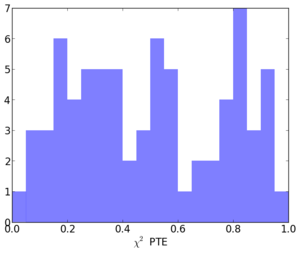 |
Figure 7: Distribution of the jackknife χ2 PTE values.
|
PNG |
| Undeprojected residual difference |
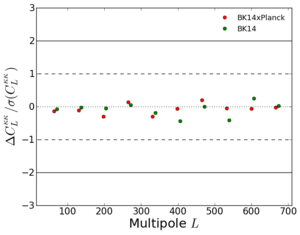 |
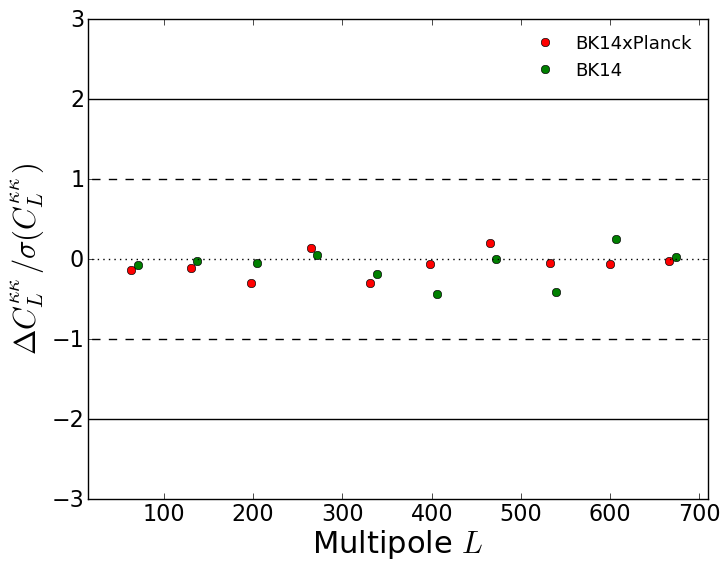
Figure 8: The difference of the lensing power spectrum when subtracting from the BK14 Q/U maps a nominal undeprojected residual as derived from per-channel beam maps (red: BK14×Planck, blue: BK14), divided by the 1σ statistical uncertainty.
|
PNG |