-
BK-IX: New Bounds on Anisotropies of CMB Polarization Rotation and Implications for Axion-Like Particles and Primordial Magnetic Fields
The Keck Array and BICEP2 Collaborations, Phys. Rev. D 96, 102003, 2017
| Data Products | |
|---|---|
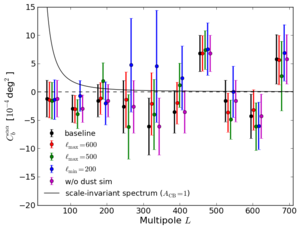
| Text file containing bandpowers and error bars for anisotropic cosmological birefringence (ACB) spectrum, Cααb. These values are for the “baseline” analysis, corresponding to the black points on Figure 1. Units are degrees2. | |
| Figures | Download Bundle | ||
|---|---|---|---|
| Angular power spectrum of rotation anisotropies |  |
Figure 1: Angular power spectrum of rotation anisotropies measured from BK14 real data using the standard lensed-ΛCDM+noise+dust simulation to obtain the power spectrum and uncertainties. In addition to the baseline analysis we also show cases with different choices of CMB multipole range used for the rotation angle reconstruction and a case without inclusion of the dust simulation. We group the multipoles up to 700 in 10 bins. The solid line shows the scale-invariant spectrum of Eq. (5) with ACB = 1. | PNG |
| Histogram of rotation spectrum amplitude |  |
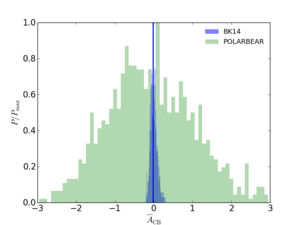
Figure 2: Histogram of rotation spectrum amplitude ÂCB from BK14 data. The blue histogram shows the results from the standard ΛCDM simulations while the green histogram shows the POLARBEAR results (POLARBEAR Collaboration 2015, Phys. Rev. D, 92, 12, 123509). The blue vertical line shows the value from the observed spectrum. | PNG |
History
- 2020-03-10: Posted text file containing baseline ACB spectrum
- 2017-05-16: Posted BK-IX: New Bounds on Anisotropies of CMB Polarization Rotation and Implications for Axion-Like Particles and Primordial Magnetic Fields figures.